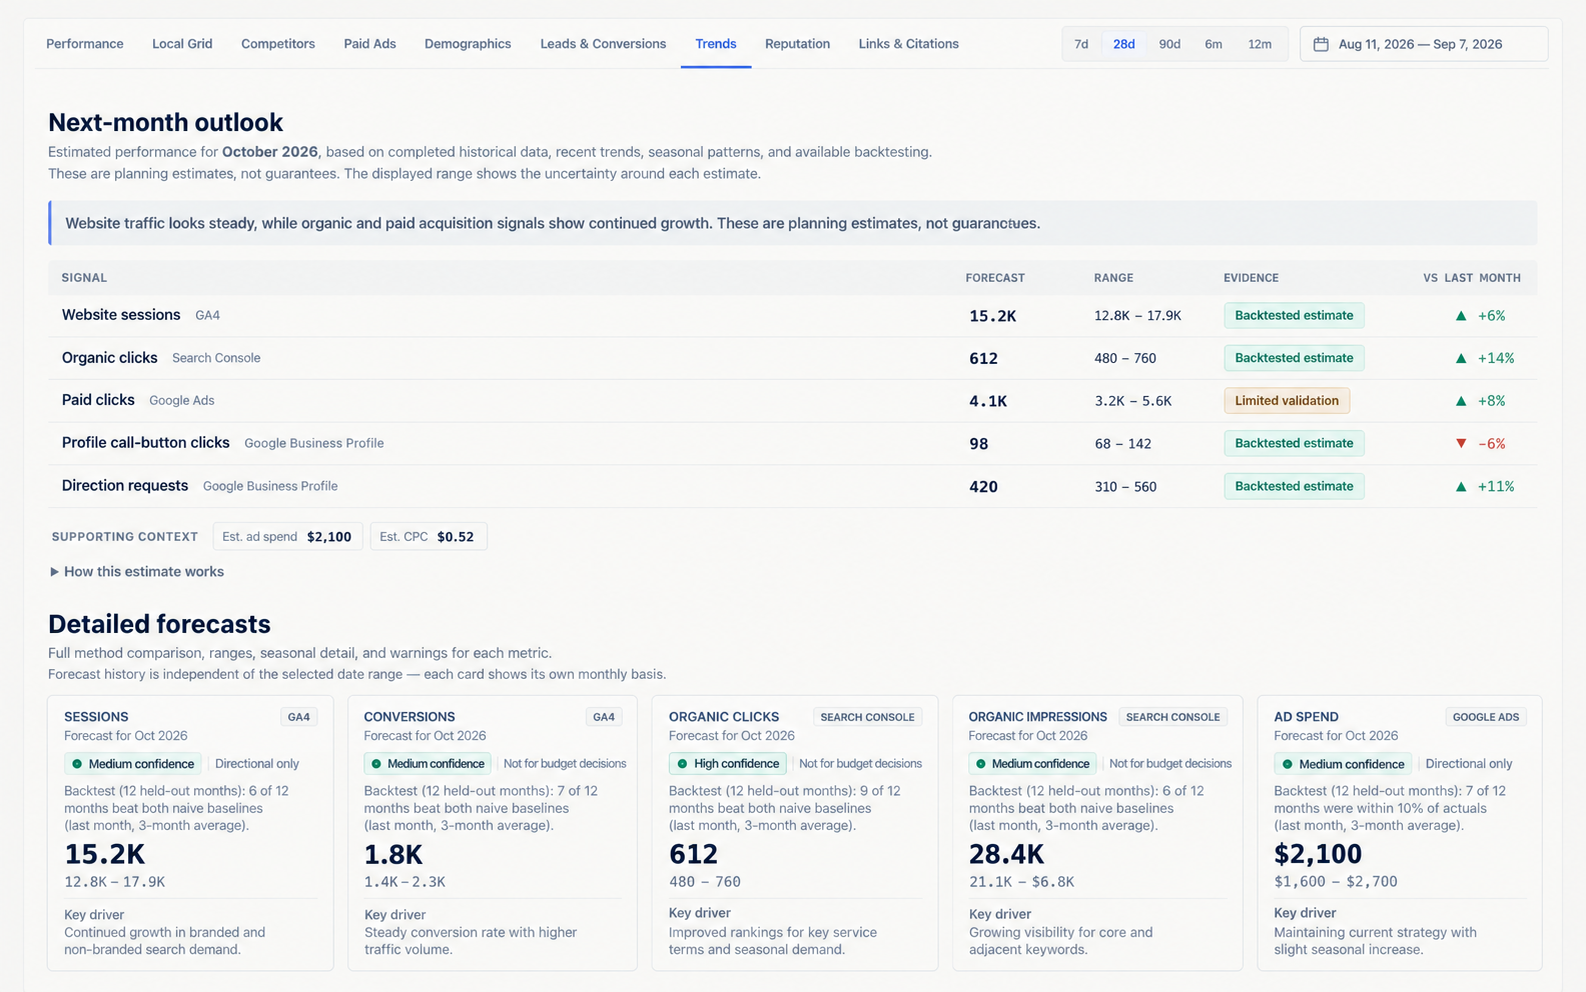
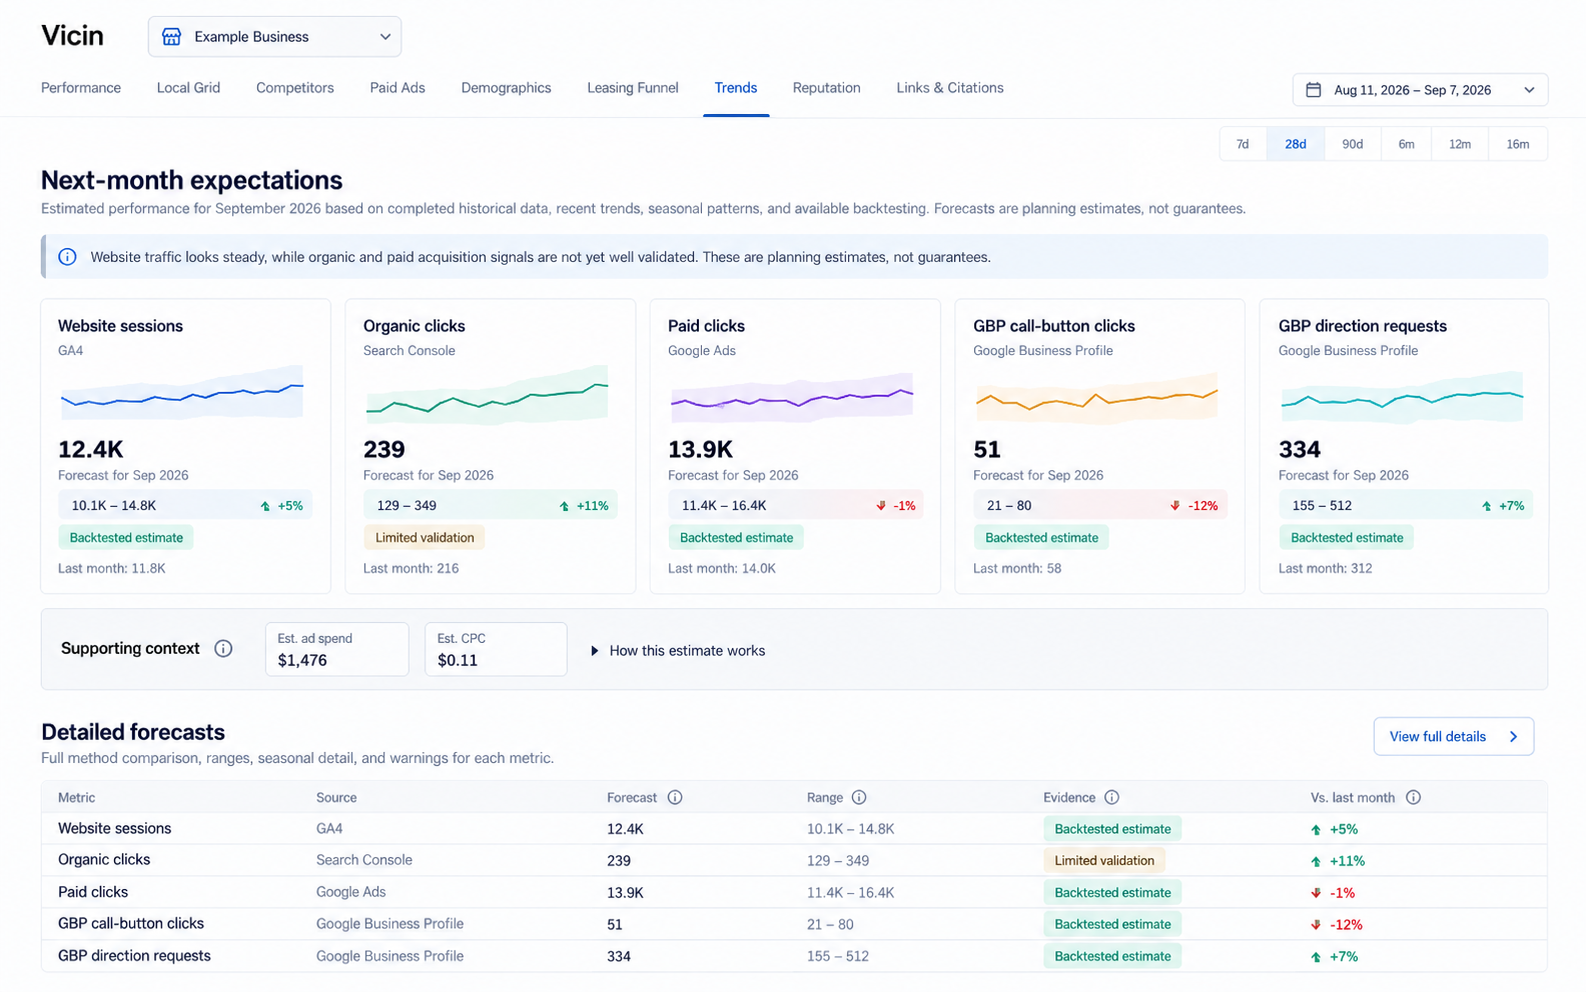
Vicin estimates the next full calendar month from completed historical periods. Each available metric shows an expected value, a forecast range, a confidence level, and a comparison with the last completed month.
Forecast the next full calendar month using completed historical periods.
Planning estimates, not guarantees. Each metric earns its own forecast or a clear evidence state.
How to read each forecast
01
Expected value
The central estimate from the selected forecast method.
02
Forecast range
A lower and upper bound that keeps uncertainty beside the estimate.
03
Confidence
High, Medium, Low, or insufficient, based on the history and validation behind that metric.
Read the expected value, range, and confidence together. No single number drives the forecast. A monthly marketing forecast estimates what selected marketing metrics may do during the next full calendar month based on completed historical periods, trends, seasonal behavior, and forecast testing
The planning baseline
A number means more when you know what the month was expected to do.
A decline can still beat a seasonal marketing expectation. A rise can still trail a month that usually grows faster. Month-over-month direction alone cannot tell you which happened.
The useful question is not only whether performance rose or fell. It is whether the result matched the evidence for that month.
Forecast coverage
One forecast surface, metric by metric.
Vicin creates a separate marketing metrics forecast for each supported measure and selected location. One source may have enough history, while another may not.
Website activity
GA4
Sessions, Conversions, and Lead Actions from the location's effective lead definition. Completed GA4 history is used to forecast next month’s website traffic, conversions, and configured lead actions when enough data is available.
Organic search
Google Search Console
Organic Clicks and Organic Impressions from the completed monthly history. The organic search forecast estimates next month’s clicks and impressions from completed Search Console history.
Paid search
Google Ads
Ad Spend, Ad Clicks, Ad Impressions, and Ad Conversions when the source and history support them. The Google Ads forecast covers supported paid search metrics, including spend, clicks, impressions, and conversions.
Example Next Month outlook using demonstration data.
Availability states
Evidence is assessed for each metric.
The page distinguishes a usable forecast from short history, an unavailable source, and a model that cannot support a reliable estimate.
Forecast available
The metric has a publishable point estimate, range, confidence tier, and supporting detail.
Not enough history
The metric has fewer than 12 completed months, so Vicin publishes no point estimate.
Source unavailable
The required source could not supply the metric, so no forecast was attempted.
No reliable estimate
History exists, but the evidence fails the forecast's reliability checks. The page shows the reason instead of a number.
Forecast evidence
What evidence is this forecast built from?
Vicin separates the evidence, the candidate methods, the historical test, and the displayed result so the estimate can be inspected rather than merely accepted.
When usable backtesting exists, Vicin selects the candidate with the best out-of-sample error. When it does not, the page labels the limited validation.
Example detailed forecast cards using demonstration data.
01Completed monthly history
02Linear trend
03Seasonal pattern
04Full-history estimate
05Recent-year estimate
06Recent-six-month estimate
07Out-of-sample backtesting
08Selected method
09Range and confidence
Why compare more than one historical window?
The longest record can preserve recurring patterns. Recent windows can better reflect a business whose baseline has changed. Vicin calculates both before choosing what to display.
Longest view
Full history
Keeps the longest available record in view, including older seasonal evidence and long-term direction.
Recent cycle
Latest 12 months
Focuses on the latest full year, which can reflect a newer baseline while retaining a complete seasonal cycle.
Near-term direction
Latest six months
Looks for recent movement. This shorter candidate does not receive a seasonal adjustment because it has fewer than 12 months.
Vicin does not assume the longest history or the latest trend should control. It compares candidate approaches against historical evidence.
Seasonal Patterns
Seasonality belongs to the month being forecast.
January should not be treated as a copy of December. Vicin checks how the target calendar month has behaved after accounting for the underlying trend.
Seasonal Patterns shows whether completed months typically sat above or below each metric's fitted trend line. That separates recurring monthly behavior from simple growth or decline.
Next Month uses a shrunk seasonal factor for the target month. The adjustment is restrained so a small same-month sample does not control the forecast.
Read the Seasonal Patterns view as descriptive history and the Next Month range as the planning estimate. They are connected, but they do different jobs.
Example Seasonal Patterns view using demonstration data. A seasonal marketing forecast should account for how the target calendar month has behaved in prior years, not only whether recent performance rose or fell.
Range and confidence
Confidence is earned, and uncertainty stays visible.
The point estimate never stands alone. The range and confidence tier travel with it, along with backtest detail and any warnings that matter.
High confidence
Decision-useful. It requires enough history, a sufficient common holdout, and a selected method that beats both simple historical baselines out-of-sample.
Medium confidence
Directional only. The estimate is visible, but the history or validation does not meet the High threshold.
Low confidence
Not for budget decisions. Treat the direction as a weak planning signal and read the warnings beside it.
Not enough data
Insufficient data. Vicin publishes no point estimate when the reliability gate does not pass.
Forecast versus target
A forecast and a target answer different questions.
The forecast describes what the current evidence supports. The target describes what the business wants to achieve. Keeping them separate makes the stretch visible.
Evidence baseline
Forecast
The expected value, range, and confidence for the next full month.
Chosen outcome
Target
The result the business wants to reach after considering the forecast and its own priorities.
Use the gap between forecast and target to define the real planning question, not as proof that the target will be reached.
Budget planning
Use the forecast to frame the budget discussion.
A stronger or softer month changes the context for spend, but expected activity is only one part of a budget decision. Current cost and business priorities still matter.
01
Start with expected activity
Review which measured signals are expected to rise, fall, or stay near the recent baseline.
02
Add current cost context
Use Where Your Money Goes to review service cost, actual Google Ads cost, and measured cost per outcome.
03
Make the business decision
The forecast informs the budget conversation. It does not make the budget decision.
Ground monthly planning and reporting conversations in the history the account can support.
The planning loop
Use the forecast before the month, then investigate what happened.
Next Month Expectations becomes more useful when it is part of a repeatable planning and review path across Vicin. Use the next-month forecast as an input for monthly marketing planning and budget discussions.
01
Forecast
Read the expected value, range, confidence, and warnings for each available metric.
02
Set target
Choose the desired outcome relative to the evidence baseline.
03
Plan activity and budget
Decide what marketing activity and investment fit the expected conditions and business priorities.
04
Month occurs
Run the plan while the full calendar month develops.
05
Review performance
Use Performance and Trends to see what occurred across connected sources.
06
Investigate differences
Examine important changes in traffic, search, paid activity, referrals, and location-level results.
This is a user-led planning path across Vicin: forecast, choose, act, review, and investigate.
Next Month FAQ
Frequently asked questions about next-month forecasts
Short answers about timing, data, uncertainty, goals, and planning use.
What does Next Month Expectations forecast?
It forecasts supported GA4, Google Search Console, and Google Ads measures for the next full calendar month when each metric has sufficient evidence.
Why the next full calendar month?
A full-month forecast is compared with completed monthly history. The unfinished current month is excluded from those historical aggregates.
How does Vicin build the estimate?
It fits a trend across completed months, applies a restrained seasonal factor when enough history exists, calculates full-history and recent-window candidates, tests them against held-out months, and selects the display method.
Which metrics can appear?
Sessions, Conversions, Lead Actions, Organic Clicks, Organic Impressions, Ad Spend, Ad Clicks, Ad Impressions, and Ad Conversions can appear when their source and history support a forecast.
What happens with less than a year of history?
With fewer than 12 completed months, Vicin publishes no point estimate for that metric. It shows the insufficient-history state instead.
What does the forecast range mean?
It is the lower and upper band around the selected point estimate. It reflects observed forecast error when enough backtesting exists, or model residual variation when it does not. It is not a guarantee.
How should confidence be used?
High can support a decision. Medium is directional. Low is not for budget decisions. Insufficient means no point estimate is published.
How does seasonality affect the forecast?
The model checks how the target calendar month has performed relative to trend and applies a restrained factor when at least 12 months of history support it.
Is the forecast the business goal?
No. The forecast is the evidence baseline. The goal is the outcome the business chooses after reviewing that baseline.
What should I do after the month ends?
Review actual results in Performance and Trends, then investigate important differences across the connected measures that changed.
Vicin uses optional Google Analytics cookies to measure public website activity. Choose I agree to allow analytics, or Necessary only to keep Analytics off.